

Since time immemorial people have been trying to predict the future.
“From the weather forecast to the time the GPS says we’ll reach our destination,
our lives are built around futuristic fictions.”
Popular Science, Max Saunders/The Conversation, August 22, 2019
In our previous blog, predictive analytics was defined as the analysis of historical information to find patterns useful in making informed predictions about future events.
But… is it actually possible to predict the future by looking back at history? According to The Economist’s article, “Does the past predict the future?”, “…historical data remains the best way to forecast the future… Historical data may be imperfect, but it remains the only unbiased way to measure risk and make assumptions about the future.”
Predictive analytics is definitely playing a huge role in Energy Information Systems (EIS) and Automated Fault Detection and Diagnostics (AFDD). While we have already discussed AFDD to some degree in our current blog series on building analytics, future installments will touch specifically on EIS, so be sure to refer to them for a broader contextual understanding.
Now that we’ve clarified the ‘word salad’ and identified all the ingredients that make predictive analytics possible, let’s take a closer look at the practical applications aimed at improved building energy use, occupant comfort and overall facility management. One such ‘ingredient’ is predictive modeling, which we defined earlier as a process tightly coupled with statistics to predict outcomes. This is in fact at the core of predictive analytics.
Predictive Modeling
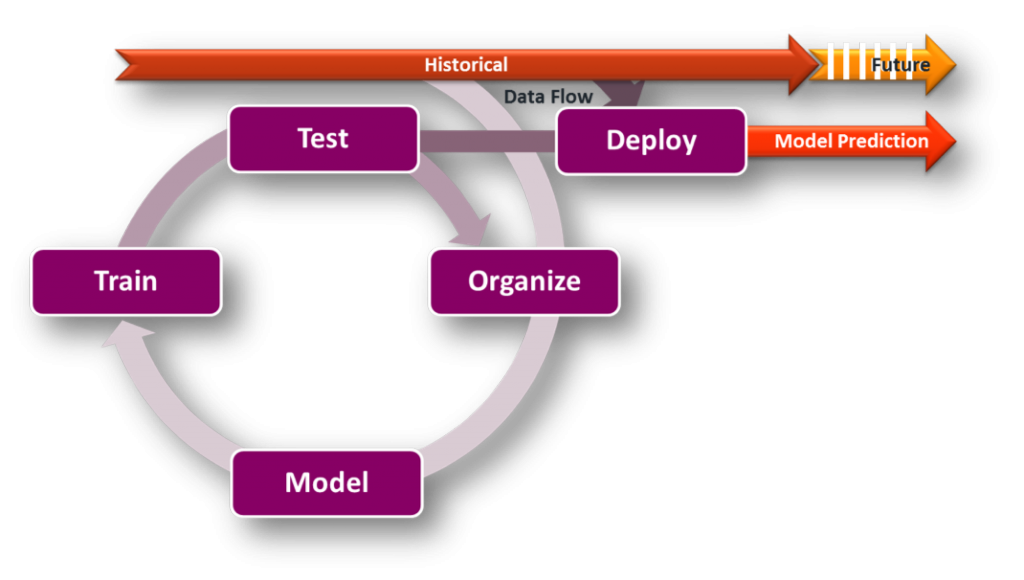
Figure 1 below depicts the modeling process, whereby the model – a mathematical representation of a given system – is created once data is organized. During the training step, the algorithm learns through observed system behavior and is followed by testing and validation. This iterative cycle continues until an acceptable model is obtained, at which time it is deployed to begin making predictions for eventual comparison with measured data. Following are three predictive modeling examples with a few practical applications relevant to buildings.
Energy Baseline Determination
Using historical data to model energy consumption is arguably the most common application of predictive analytics within our building management space. A predictive model of energy use could be developed using independent variables such as weather logs – provided there is a direct correlation with building energy consumption – aided by a linear regression function to determine the line of best fit. This model would then be fed with historical weather data to estimate energy usage, using it as the baseline to which actual energy consumption is compared against. Another typical application is to use this energy predictor with forecasted atmospheric conditions in order to implement demand limiting strategies to avoid peak demand charges.
Occupancy Prediction
An occupancy model could be developed to predict the number of occupants in a building based on historical data. For example, using historical data from passive infrared (PIR) motion detectors, Wi-Fi device counts or plug loads, an occupancy profile model could be developed with the help of data mining and machine learning techniques. Methods such as cluster analysis and statistical classification are able to group similar sets together and identify categories using training data sets and various algorithms including K-means and Bayesian classification procedures. Predicted occupancy profiles would then be used to optimize schedules, improve occupant comfort ensuring a smooth transition from unoccupied mode, and calculate the building’s actual outdoor air fraction requirements instead of using the typical 30% minimum outdoor air damper position for ventilation systems – the rule of thumb when a building is fully occupied.
System Characterization
System modeling is another application of predictive analytics, where historical data from temperature sensors and final control elements such as control valves and dampers are used to establish a mathematical model to represent the thermodynamic characteristics of any given system. Modeling approaches include white-box, grey-box, and black-box models, with the former being more physical and principle-based, while the latter being more empirical, thus requiring significant amounts of training data. Modeled system characteristics would then be used to identify equipment faults, including unresponsive, stuck or leaky control valves and dampers, fans and pumps showing signs of imminent failure, as well as operational inefficiencies leading to optimized control strategies for optimal energy utilization.
Ultimately, the goal of predictive analytics is to improve asset management. And this includes tangible assets such as buildings and equipment, and intangible ones such as human capital, energy, and financial assets. At CopperTree, constantly enhancing our analytics platform and services is fueled by one thing: to help you achieve such a goal.